
2026 ACSF ASAP
Mid-Year Review
Between January and June 2026, ACSF members have submitted 432 ASAP events (760 reports). Of those, 703 reports were sole source and 57 non-sole source (Primarily declared emergencies, brasher warnings, pilot deviations).
Following previous trends, human factors are still primary root cause of submitted reports with communications issues, altitude and course deviations collectively making up over 1/3 of all submissions at 35%. Traffic Proximity events are still second most common type of event at 14% (106 reports), primarily occurring in New York Metro Area, Van Nuys, and South Florida airspaces.
of reports fall into just three categories: altitude deviation, traffic proximity and crew coordination
involve aircraft mechanical issues – airframe, powerplant and structures combined
distinct event categories reported, from rejected takeoffs to airspace deviations
Private & business aviation operations · Safety event reporting. Percentages rounded; totals may not sum to 100.
SHARE OF ALL REPORTED EVENTS
Sorted by frequency
Leading categories (5% and above)
Mid-frequency (2-4%)
Low-frequency (1%)
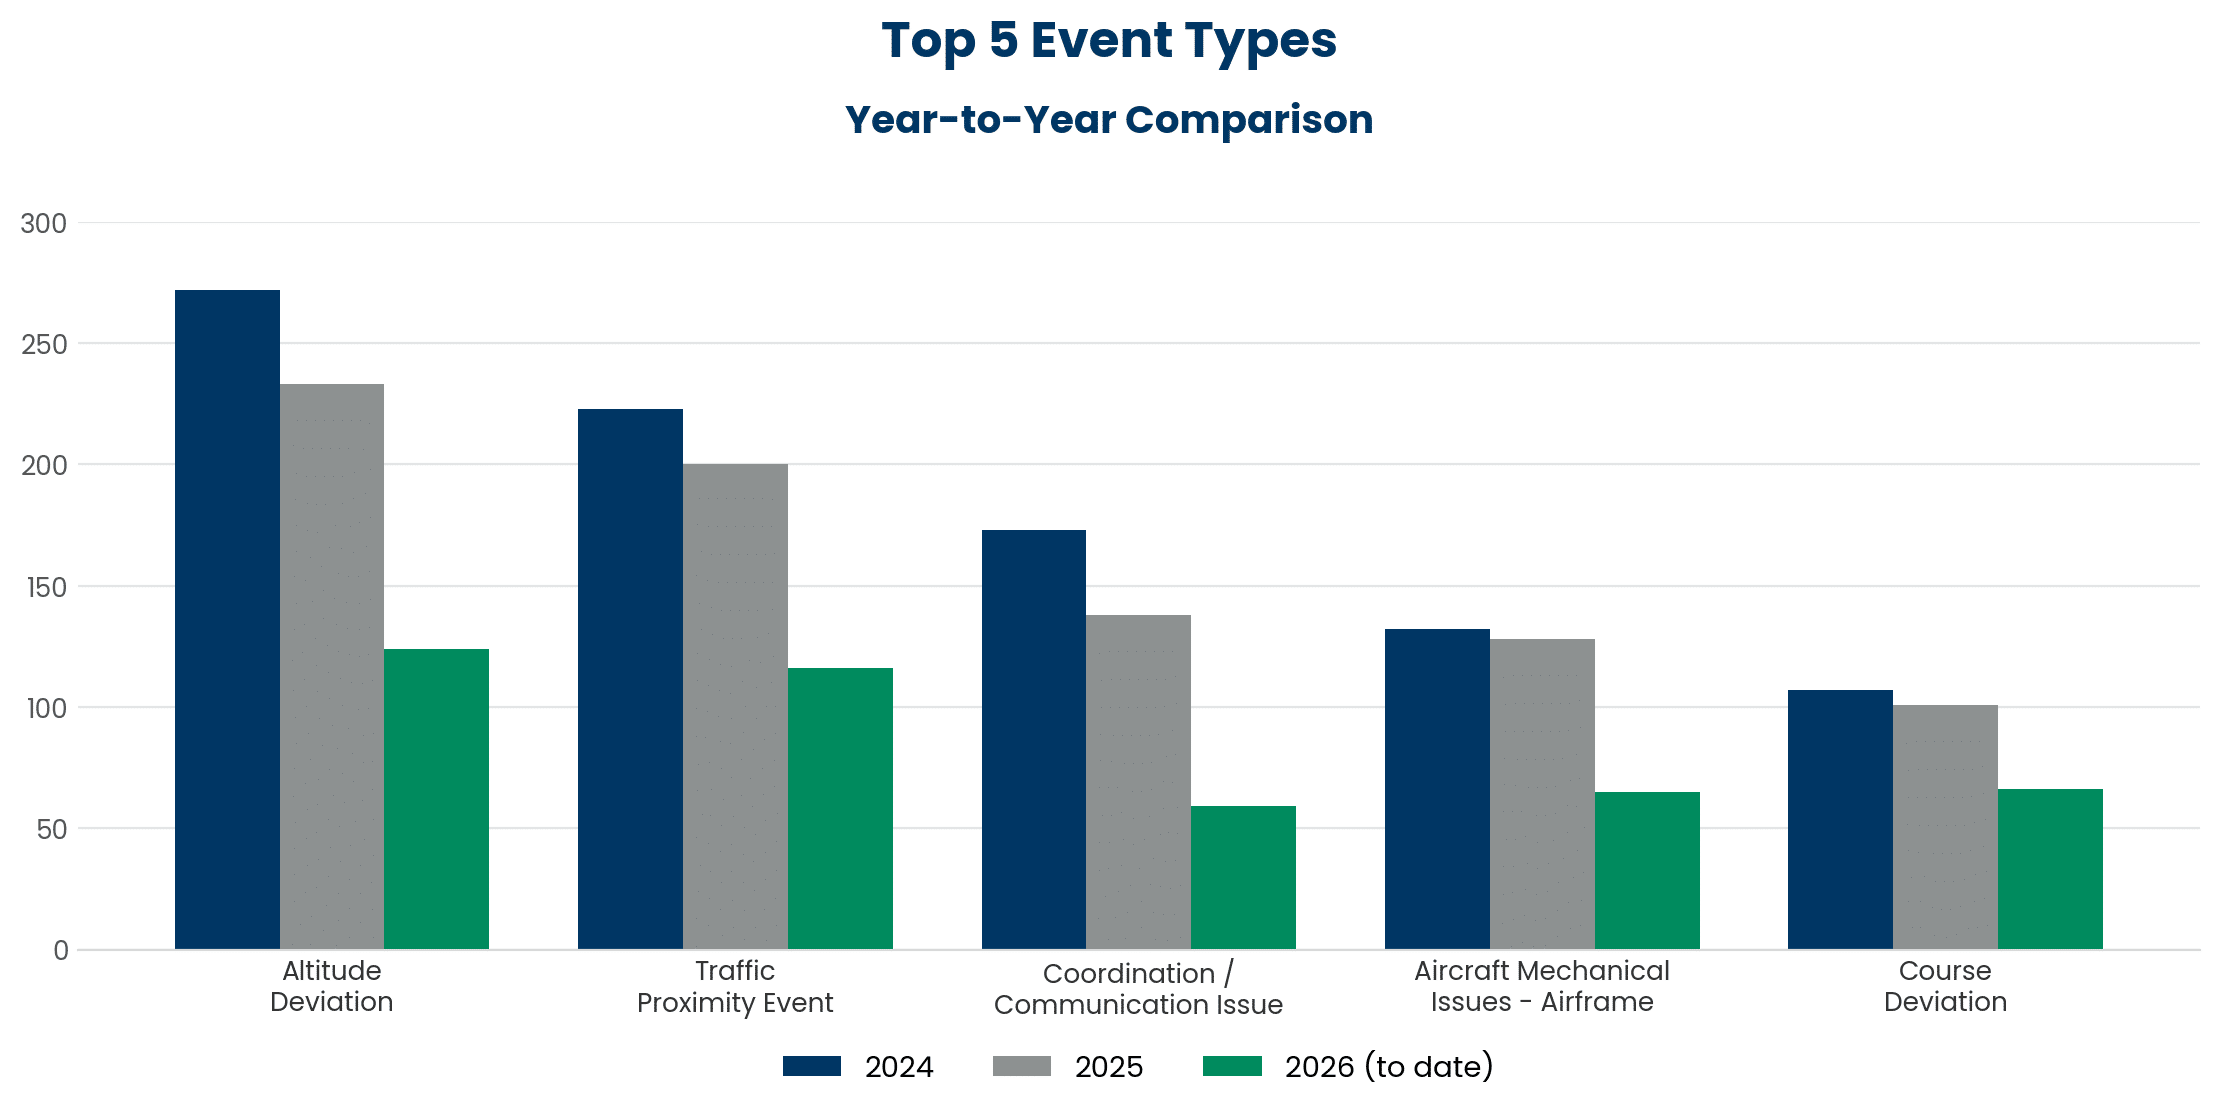
Top 5 Events
Although Altitude Deviations and Traffic Proximity Events remain as 1st and 2nd most common types of events, respectively, Course Deviation and Airframe Mechanical Issues have surpassed Coordination/Communication issues at 8% each.
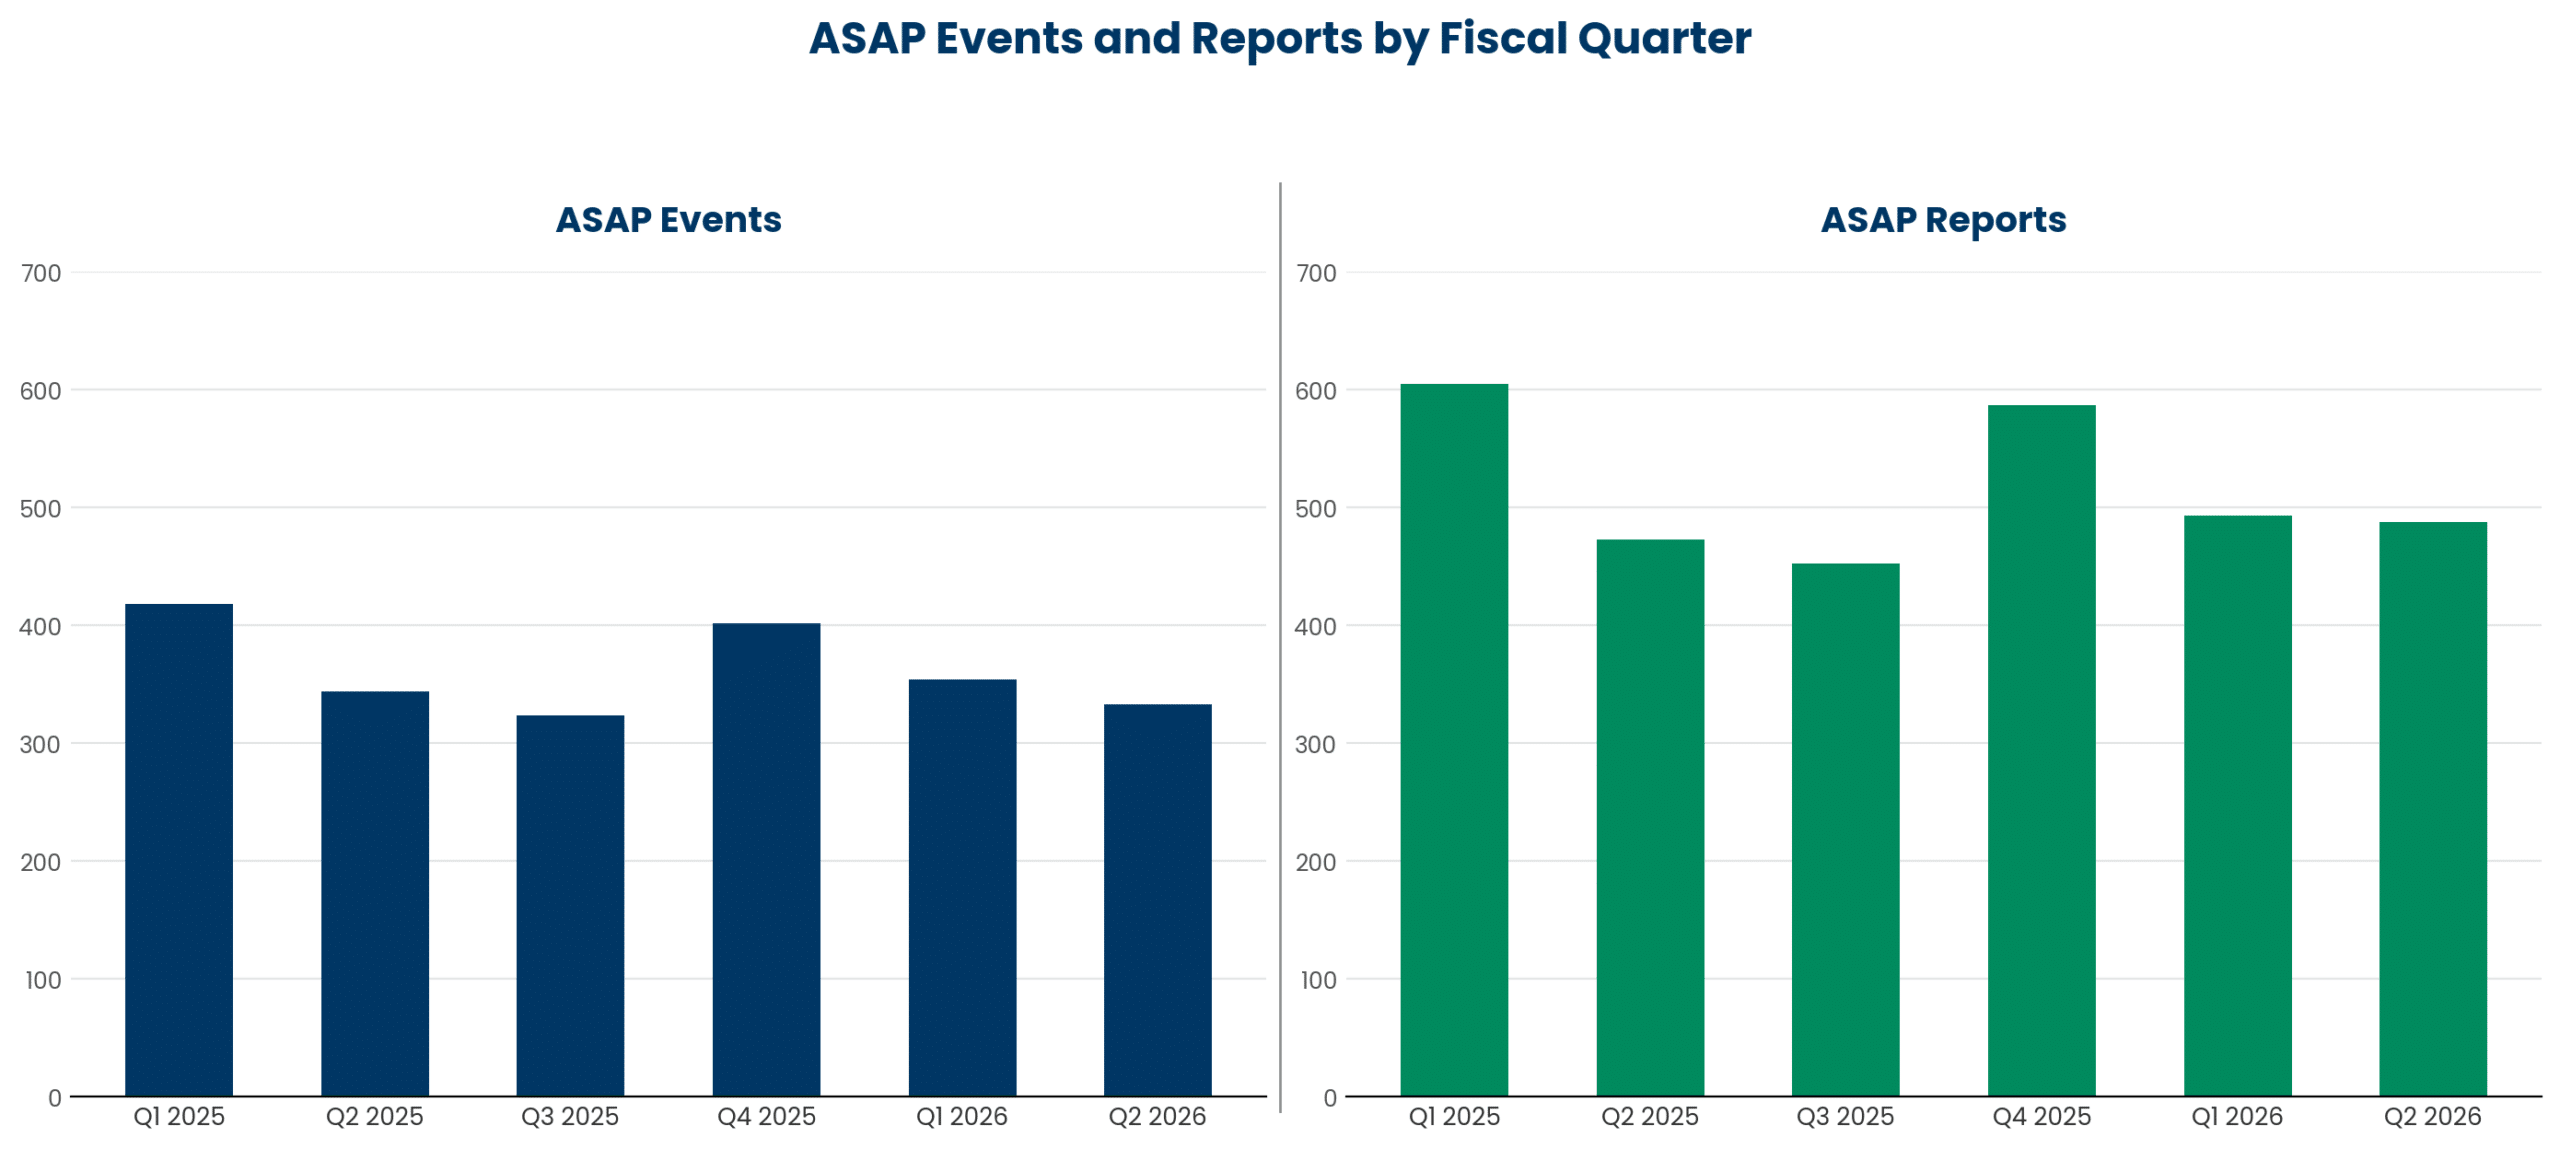
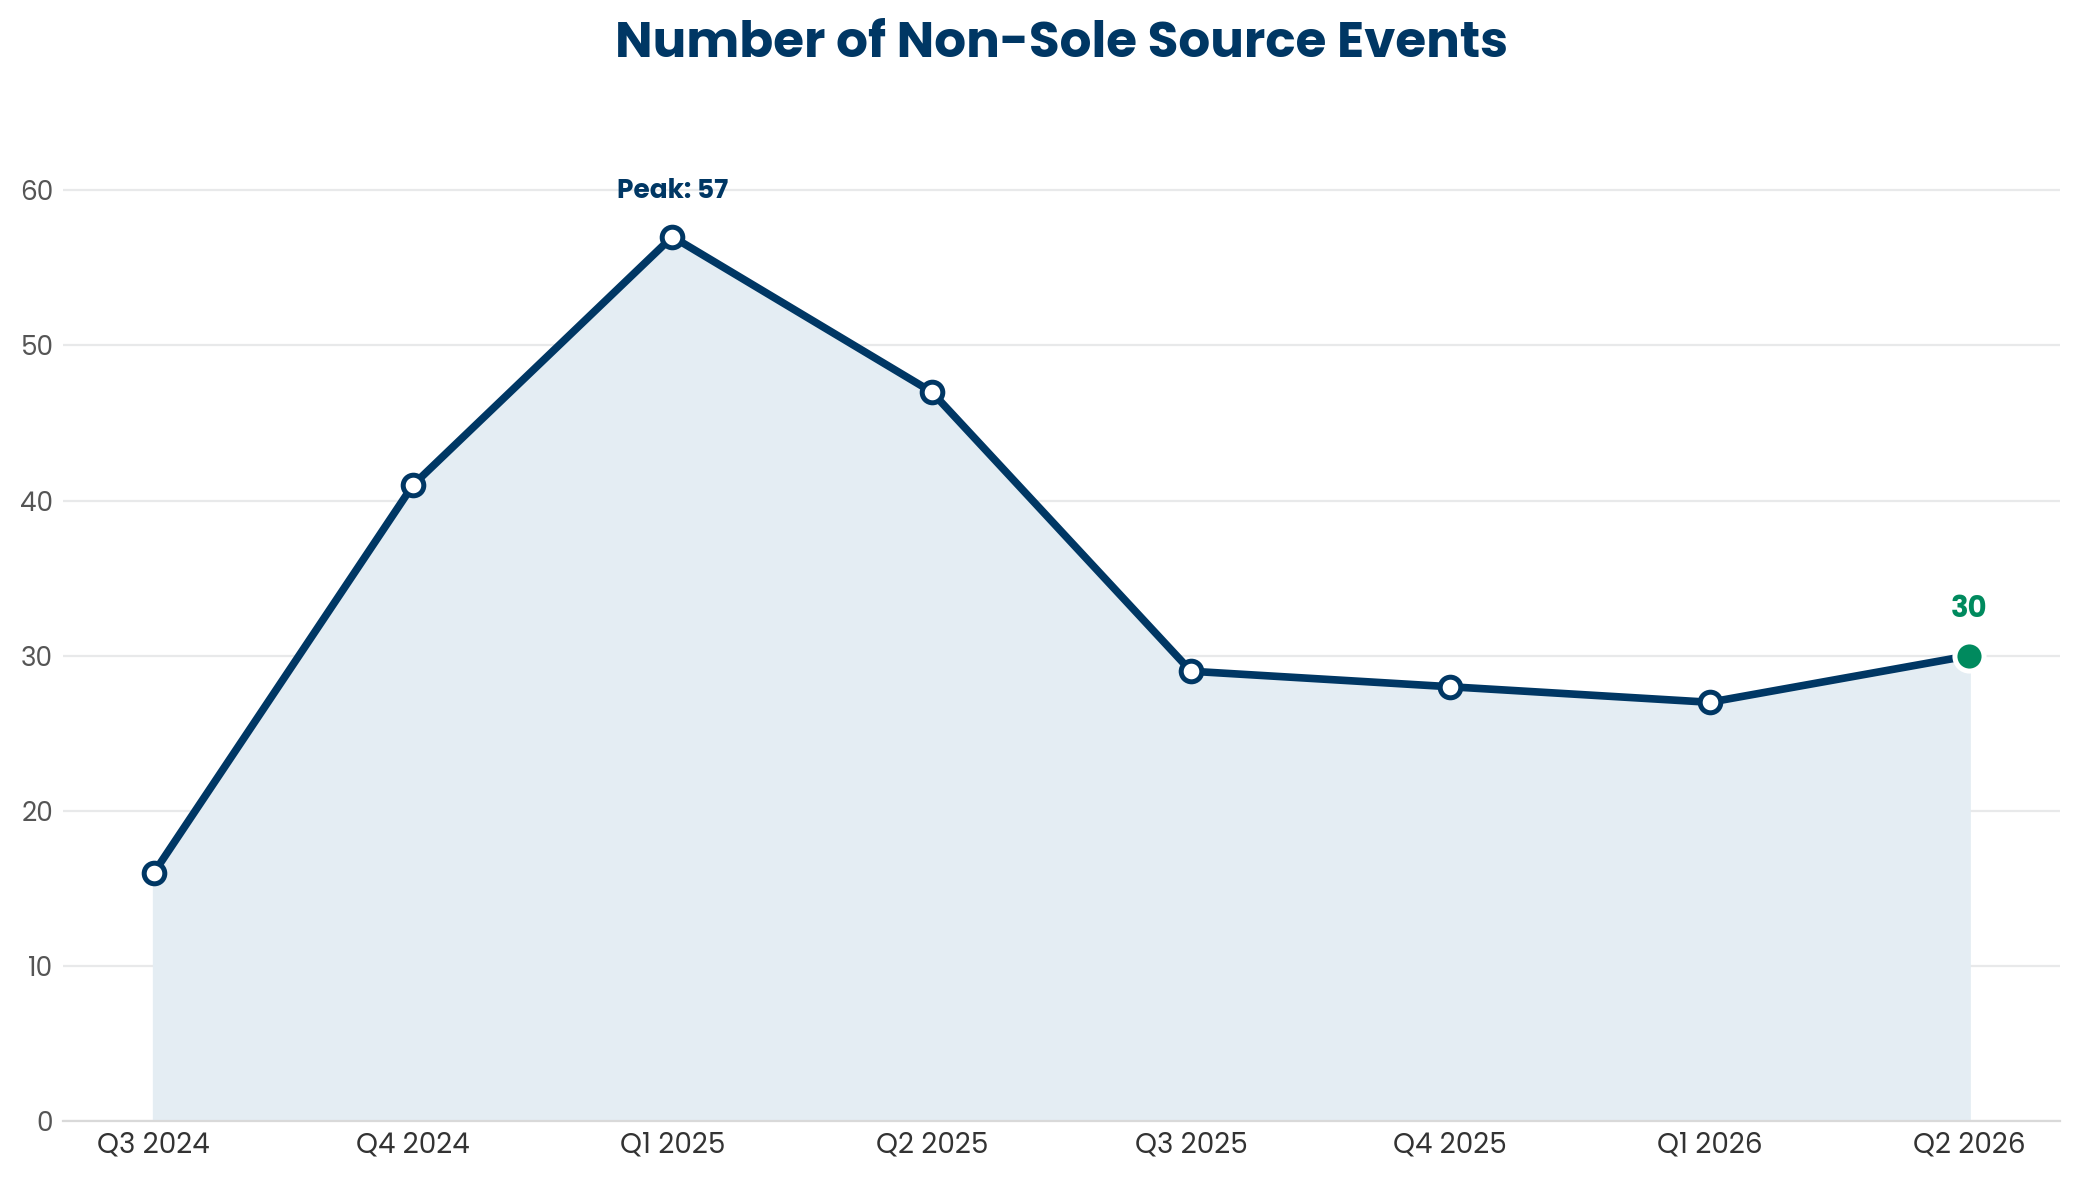
Reporting trends by fiscal quarters continue to follow a predictable pattern, with spike in submission during Q4 and Q1 likely driven by winter weather impacts and increased holiday travel. Interestingly, the number of non-sole source events (brasher warnings, pilot deviations, declared emergencies) has been on rapid decline since 2025 Q1, dropping from 57 down to below 30 in the last 4 quarters.
Mid-Year Analysis in Comparison to 2024 and 2025
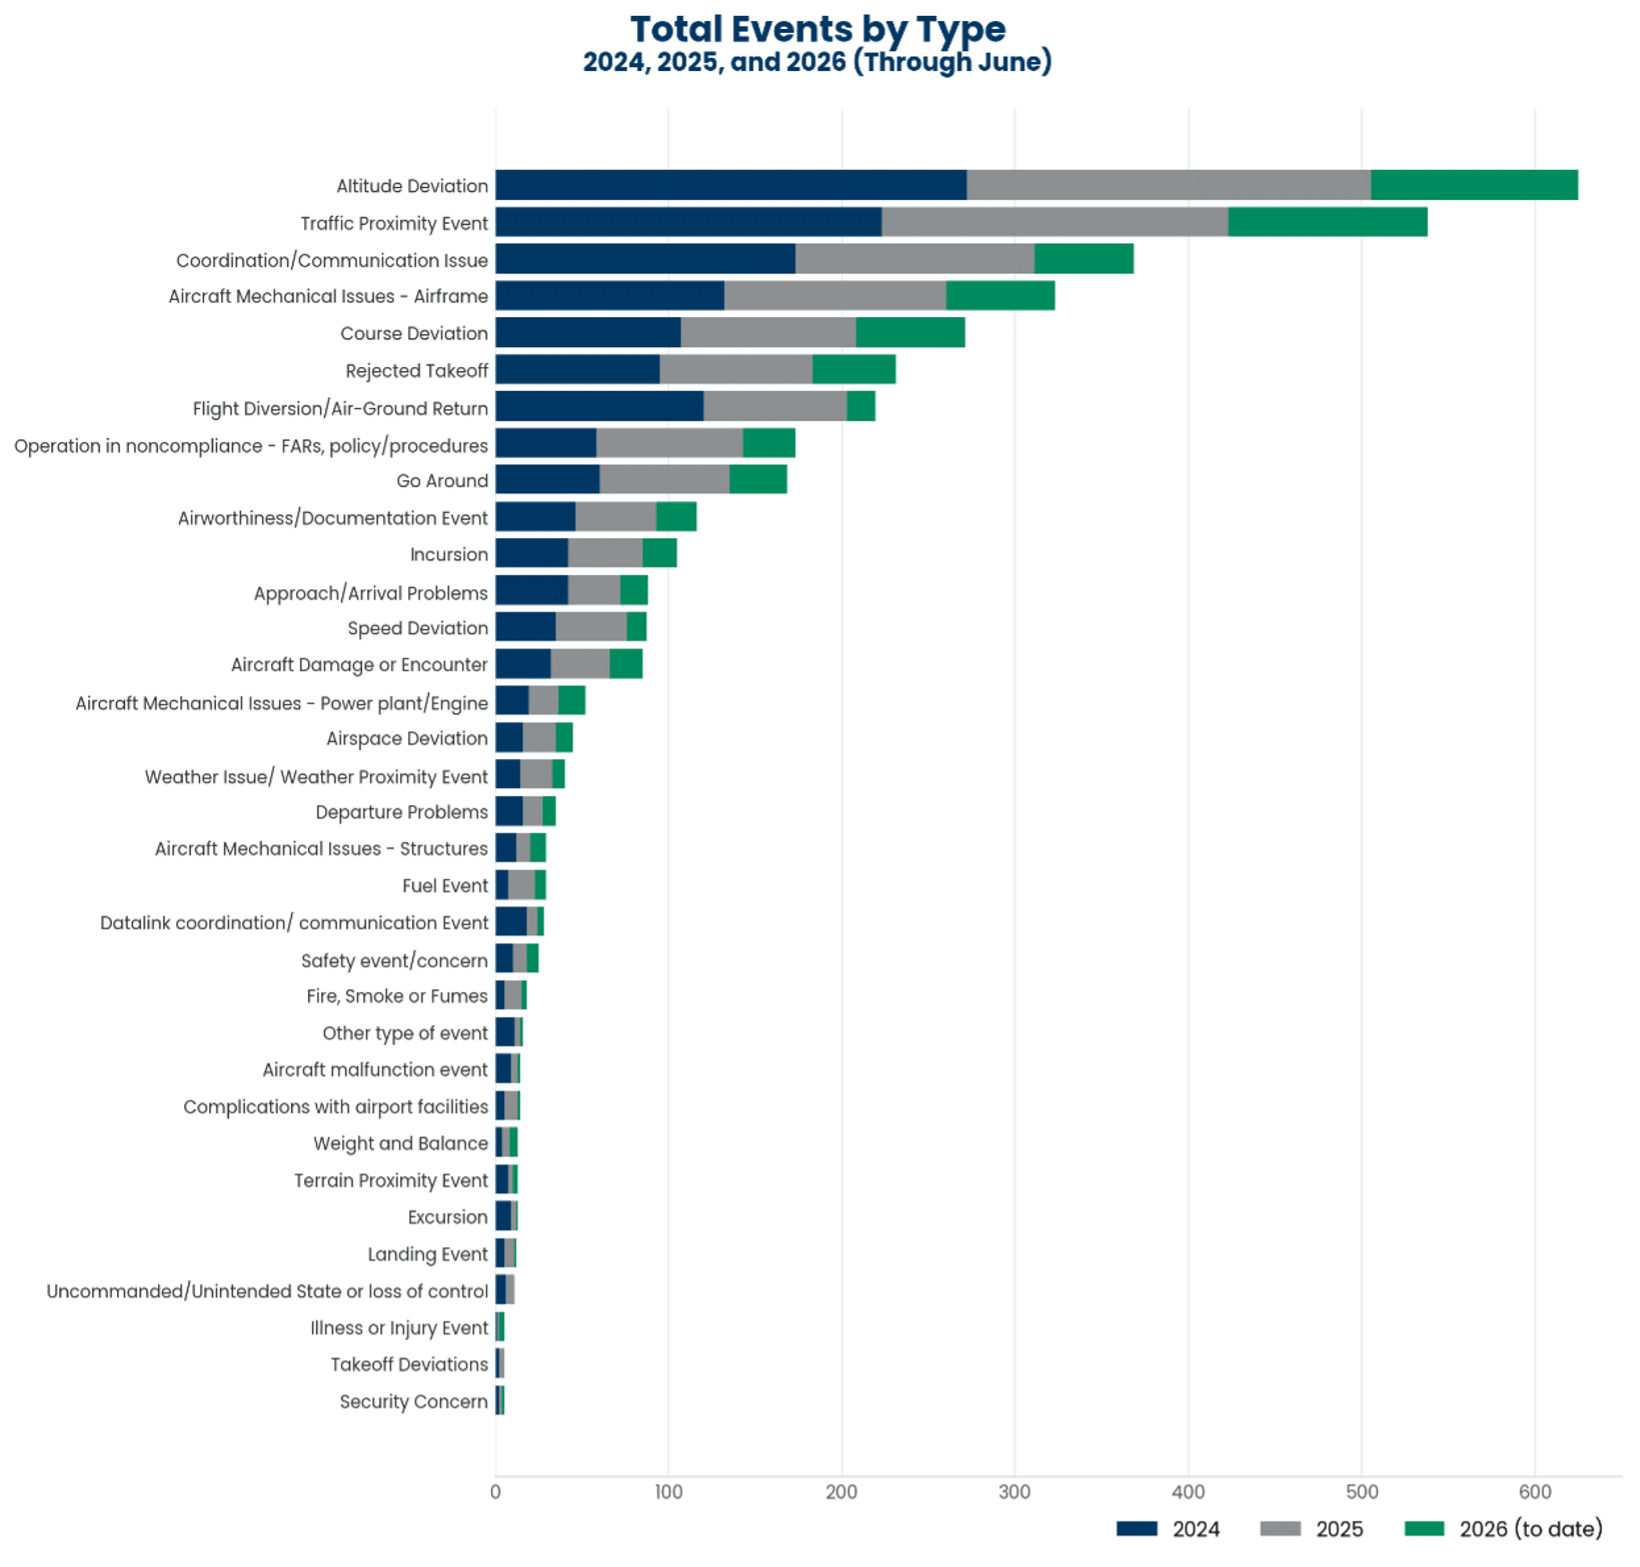
Consistency : Strip away the totals and look at composition instead, and a clearer picture emerges.
Altitude Deviation and Traffic Proximity events have been the two largest categories in every single year, together accounting for a remarkably consistent 31–33% of all reports — 2024, 2025, and 2026 alike. That stability matters more than any single year’s total. It suggests the underlying shape of operational risk hasn’t shifted.
Overall Significance
- Traffic proximity events trending down while overall air traffic trended up (record Part 135 activity, the FIFA World Cup surge) is a genuinely encouraging sign — it suggests airspace management tools are absorbing more volume without a proportional rise in near-miss reporting, not that fewer people are reporting.
- The drop in coordination/communication issues tracks with the industry-wide scrutiny and procedural tightening that followed January 2025’s high-profile midair collision in DCA — increased attention to a specific failure mode tends to show up as fewer occurrences of that failure mode within a year or two.
- The composition of risk has stayed remarkably stable, while several specific, named failure modes (communication breakdowns, airframe issues, diversions) show a genuine multi-year improvement.
ASAP Data Evaluation
Leading indicator, not lagging: As a voluntary, ASAP-style system, the program captures near-misses and procedural deviations that fall below the threshold for an NTSB investigation, giving safety departments early visibility into risk rather than after-the-fact confirmation of it.
Anonymity drives data quality: Because submissions aren’t tied to enforcement action, pilots and crews are more willing to disclose full circumstances (including their own errors) producing a more complete dataset than a punitive reporting framework would yield.
Top two categories are statistically reliable: Altitude deviation and traffic proximity events together run in the hundreds of reports annually and have held a consistent ~32% share of total volume across all three years, giving enough sample size to treat their trends as meaningful rather than noise.
Bottom line: The data is well suited to directing attention toward where risk is concentrated, but not yet refined enough to quantify how much actual risk has changed.
Business Aviation Safety: 2026(Year-To-Date) Trends and Analysis
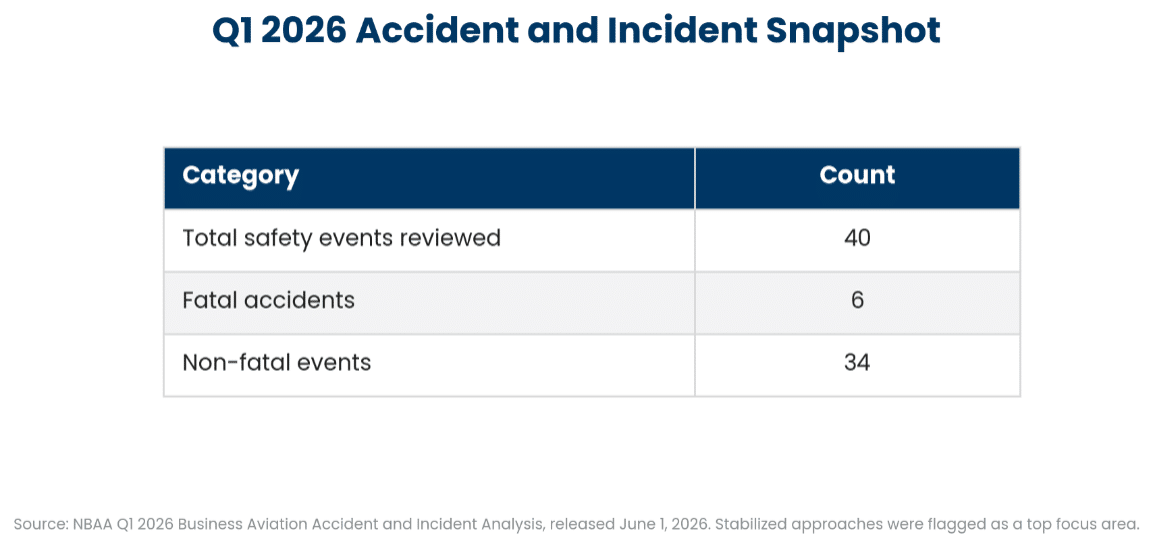
Business aviation enters the second half of 2026 in a period of visible pressure-testing. The accident rate has not deteriorated in a statistical sense, but several high-profile events have accelerated regulatory action, congressional legislation, and industry attention on long-standing risk categories.
Recurring Themes Across 2026
- Human factors (fatigue, task saturation, job pressure) remain the leading root-cause category in NTSB-reviewed mishaps, alongside persistent loss-of-control-inflight and CFIT risk.
- GPS/GNSS jamming and spoofing has moved from a niche international-ops concern to a mainstream training topic, driven by rising interference around conflict zones.
- Regulatory mandates are landing in force: expanded Part 5 SMS requirements, a new 25-hour cockpit voice recorder rule, and the ALERT Act moving through Congress.
- Ground safety and runway incursions received renewed attention, due to frequency, cost, and opportunity for catastrophic events.
- Workforce shortages are increasingly framed as a safety issue, not just a staffing one.
Safety Management Systems
(SMS) Rollout
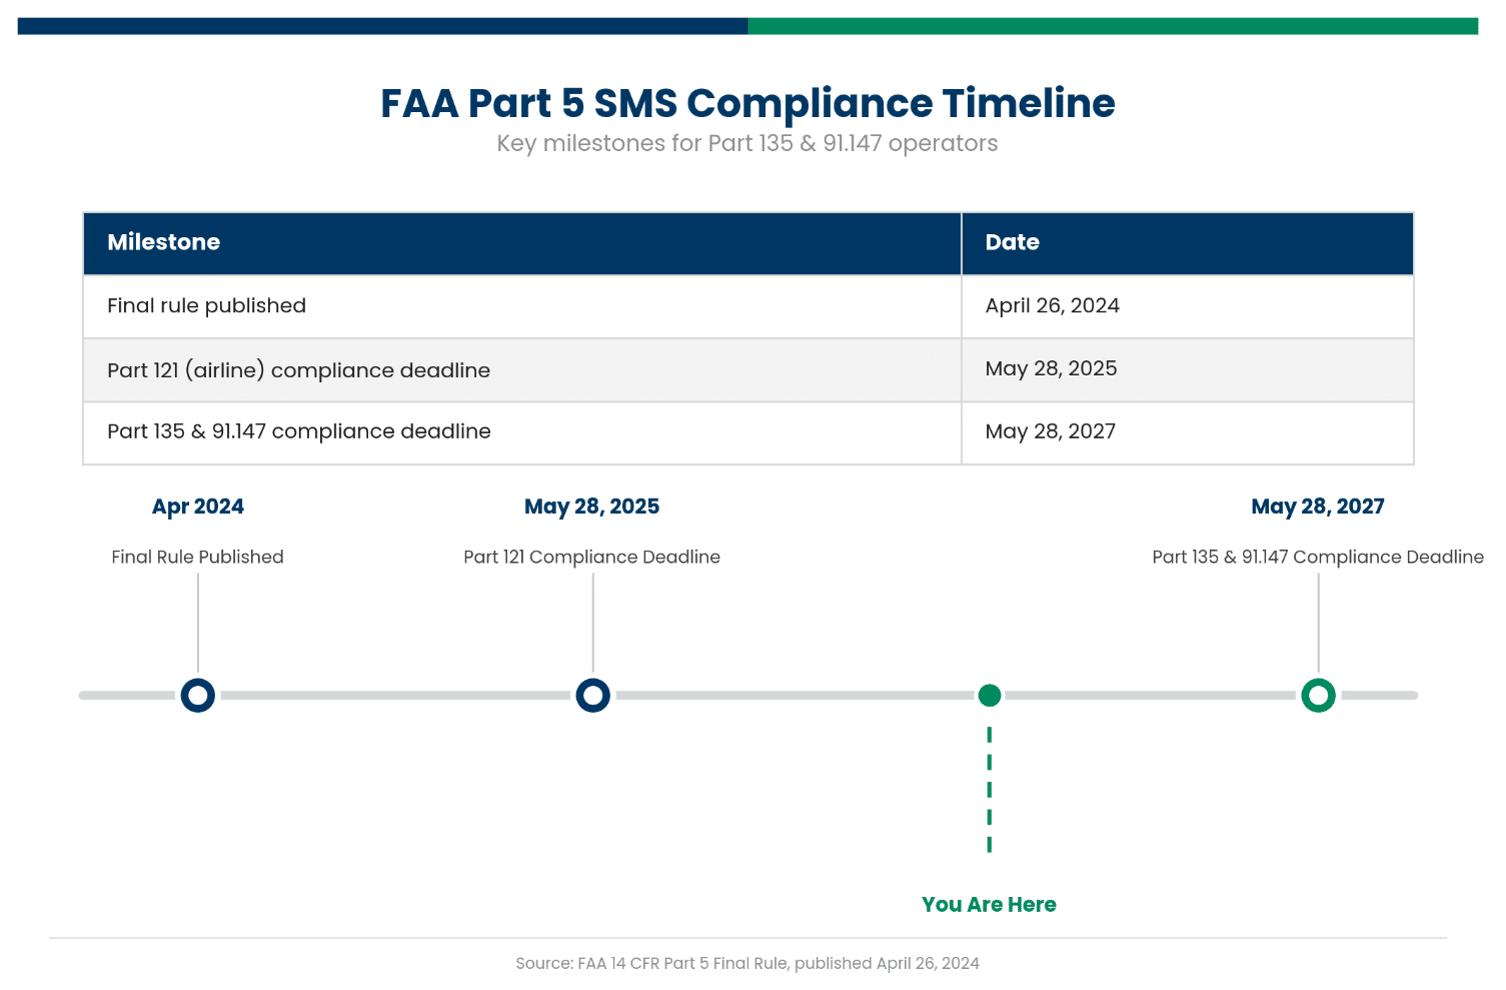
The FAA’s April 2024 revision to 14 CFR Part 5 expanded mandatory SMS requirements beyond Part 121 airlines to cover roughly 1,848 Part 135 charter and commuter operators, certain Part 21 manufacturers, and Part 91.147 air tour operators holding a letter of authorization
Implementation Status
As of early 2026, member operators describe the rollout as well underway, with real-world implementation experience now informing peer guidance rather than theoretical planning. The FAA treats SMS as scalable, meaning a single-aircraft operator is not expected to mirror an airline’s safety department, but all four SMS pillars (safety policy, safety risk management, safety assurance, and safety promotion) must be present (with operational evidence).
The Alert ACT Update
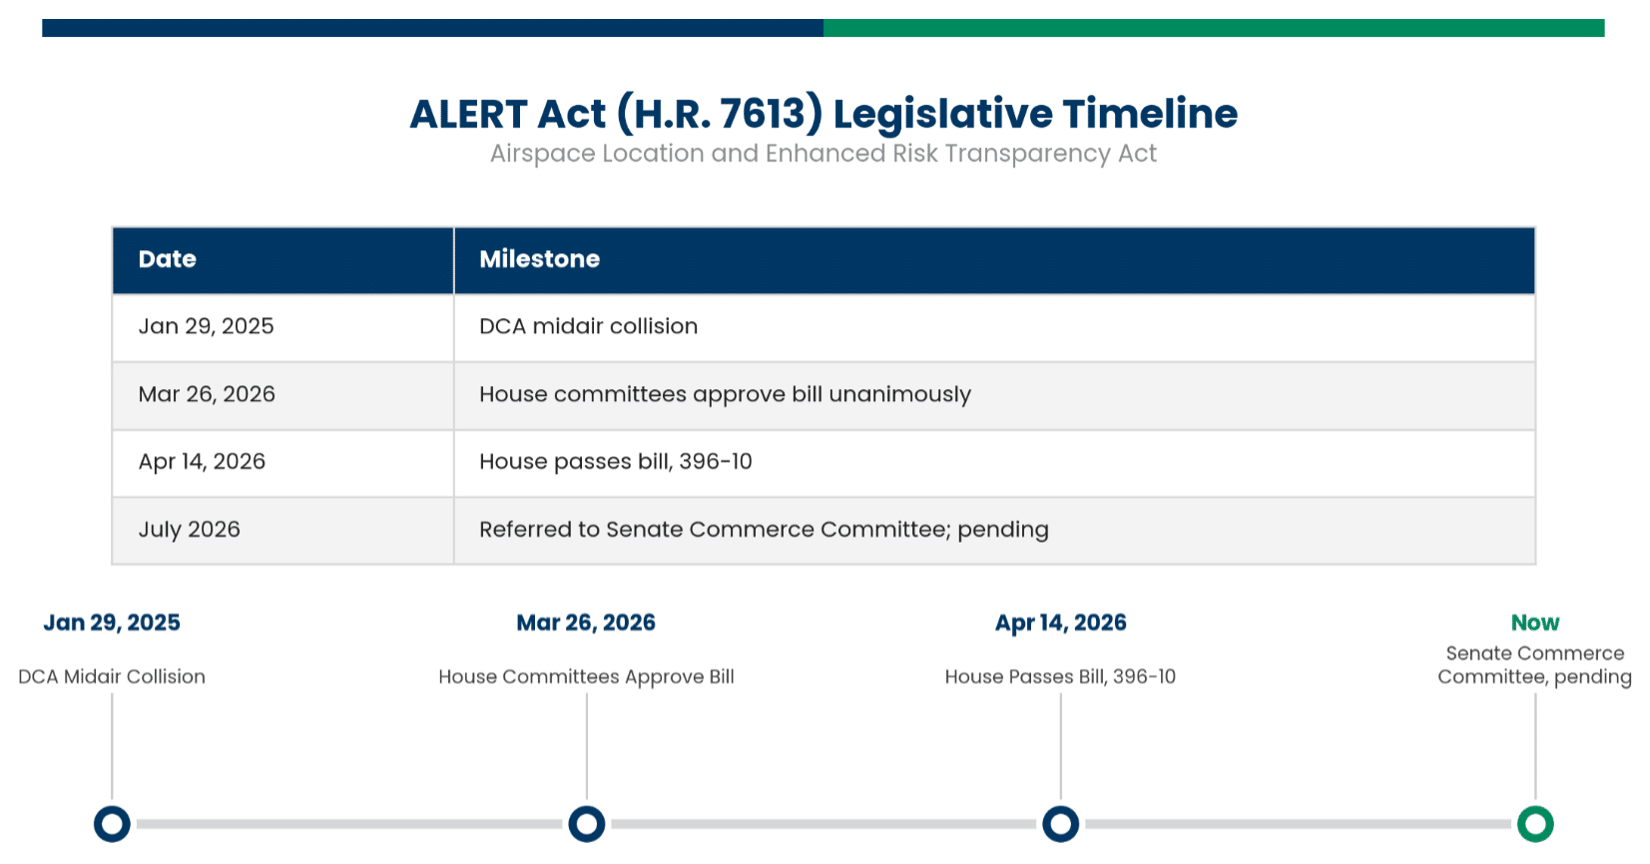
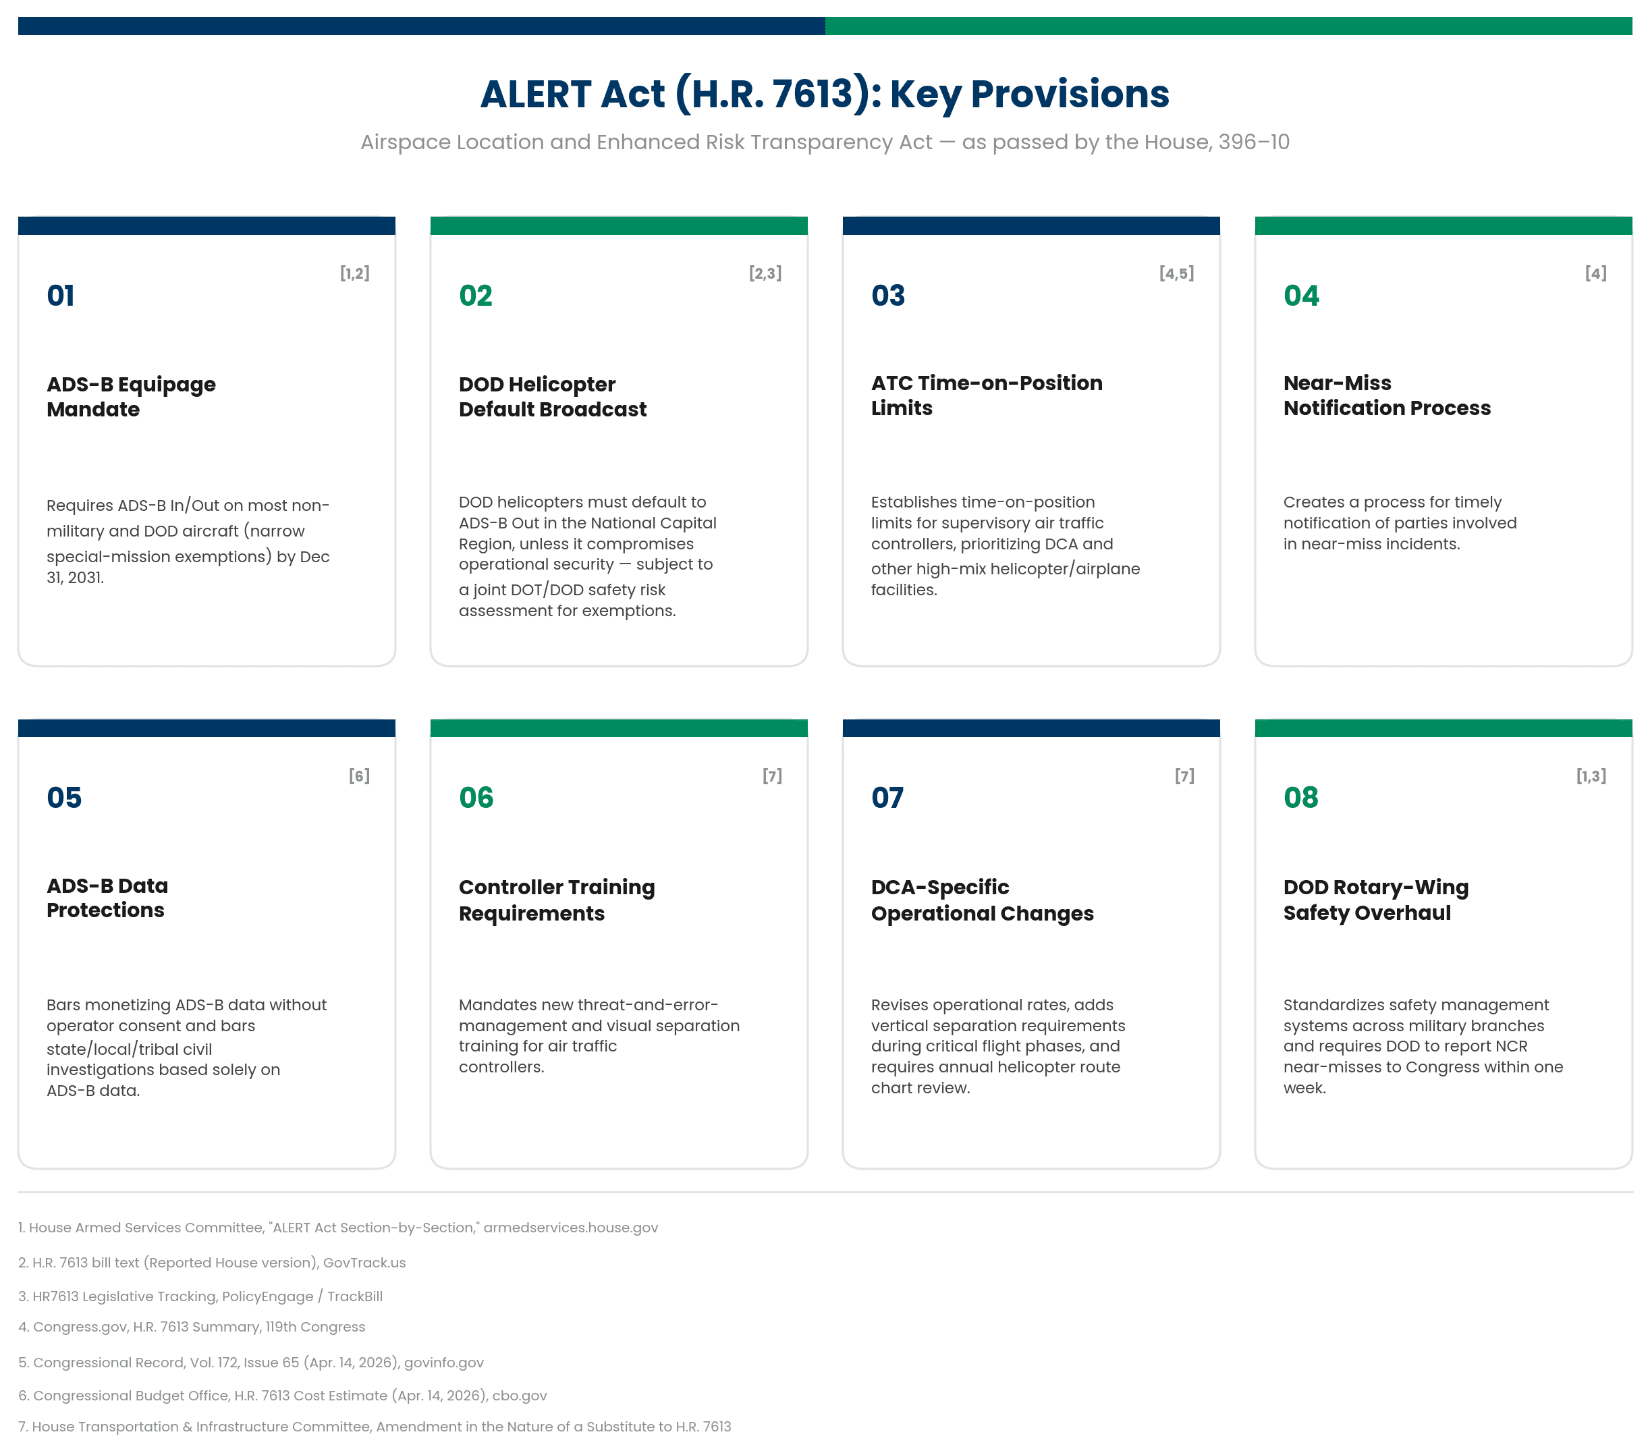
The Airspace Location and Enhanced Risk Transparency (ALERT) Act is the direct legislative response to the January 29, 2025 midair collision between American Airlines Flight 5342 and a U.S. Army Black Hawk helicopter near Reagan Washington National Airport (DCA), which killed 67 people.
The NTSB’s investigation into the DCA collision produced 74 findings and 50 safety recommendations, and the Board has publicly credited House committees with incorporating its technical input before the floor vote. The remaining hold-up is chamber reconciliation rather than opposition: the Senate has related, overlapping work underway via the ROTOR Act and the FAA SMS Compliance Review Act.
Other Industry Safety Intelligence
GPS/GNSS Jamming and Spoofing
The FAA and EASA have documented a marked increase in GNSS interference since 2022, concentrated around active conflict zones (Eastern Mediterranean/Black Sea, Russia/Baltic states, India-Pakistan border, Iraq/Iran, the Korean Peninsula, and Beijing). Jamming is comparatively straightforward to address through prompt recognition and reversion to backup navigation; spoofing presents a more difficult challenge, as false position data may appear internally consistent, requiring independent cross-validation of position, route, and timing. Multi-constellation receivers and EFBs with independently sourced GPS antennas represent the principal technical mitigations currently in use.
The Iran Conflict
The dominant risk to civil aviation is not deliberate targeting but misidentification by air defense systems operating under heightened alert, consistent with the failure mode observed in the 2020 downing of Ukraine International Airlines Flight 752. This risk is compounded by elevated GNSS interference attributable to the conflict. War-risk insurance premiums have repriced accordingly, with Gulf-region evacuation charters roughly doubling in cost (approximately $114,000 to $171,000–$228,000). Following the 2025 AerCap Ireland v. AIG ruling, aircraft parked at affected hubs may be deemed “in the grip of war” for coverage purposes; several aircraft have already sustained strike damage on the ground in Dubai, Abu Dhabi, Bahrain, and Kuwait.
FIFA World Cup 2026
The tournament (June 11–July 19, sixteen host cities, over six million visitors) represented a bounded, well-modeled demand surge. The FAA applied existing mass-event tools, including Super Bowl-style slot reservations, standardized temporary flight restrictions, reliever-airport routing, and enforced no-drone zones. The principal concerns were airspace and ATC saturation alongside ground security, rather than accident risk; Transport Canada separately flagged 5G-related radio altimeter interference for arrivals into Toronto and Vancouver. The event concluded without reported business-aviation accidents.